> For the complete documentation index, see [llms.txt](https://docs.plenit.com/llms.txt). Markdown versions of documentation pages are available by appending `.md` to page URLs; this page is available as [Markdown](https://docs.plenit.com/docs-en/productos/servers-1/how-to/vpn-logs-and-troubleshooting.md).
# How to Manage Your VPN Logs and Diagnose Issues
The troubleshooting console lets you **generate, consult, and download** the VPN tunnel logs from the panel, and diagnose most incidents on your own.
The key is to read the log to know **at which stage** the connection fails.
> #### 👍 What you get
>
> Locate the exact point of failure (the initial connection or data transfer) and the action that fixes it, without relying on support in most cases.
### Before you start
* Have access to the panel with permissions over the network subscription.
* Have a VPN tunnel created, whether operational or not.
* Optionally, access to the remote machine logs to correlate if you need to go further.
### Step 1. Generate and review the logs
1. Log in to your VPN subscription and open **Troubleshooting / Logs**.
2. Click **Generate logs**.
3. In the console you can **view** the exchange events, **search** terms, **copy** snippets and **download** the file `.log` to review it locally.
Recommended search terms: `error`, `failed`, `proposal`, `AUTH`, `TS_`, `CHILD_SA`, `responding`.
{/\* 📸 CAPTURE 1 · Troubleshooting / Logs console with the Generate logs button and the search box \*/}

> #### 📘 Two details so you don't get confused
>
> * **Time zone**: the logs show the time converted to your time zone, so the timestamp matches the real time of the test and you can compare it with the remote machine's log.
> * **Size-based rotation**: the history is managed by size, not by days. If you're chasing a specific failure, reproduce it and generate the logs right after.
### The two phases of the connection
A site-to-site tunnel is brought up in two phases. Knowing which one fails takes you straight to the cause.
#### Phase 1 — Initial connection (IKE)
The two ends validate each other and agree on how they will talk. When it goes well, the log shows `IKE_SA ... established`. If it fails, the usual causes are that the other end does not respond (connectivity or closed ports), that basic settings do not match (for example encryption), or that the key (PSK) or identity do not match.
#### Phase 2 — Data transfer (IPsec / CHILD\_SA)
With the initial connection ready, the tunnel through which real traffic travels is created. When it goes well, appears `CHILD_SA ... established`. If it fails, the usual causes are that the subnets do not match on both sides, that a firewall or policy blocks the traffic, or that routes to the remote network are missing.
> #### 📘 Quick rule
>
> If you see `IKE_SA ... established` but not `CHILD_SA ... established`, the problem is in networks, routes, or firewall (Phase 2). If you don't get to `IKE_SA ... established`, it's in the initial connection (Phase 1).
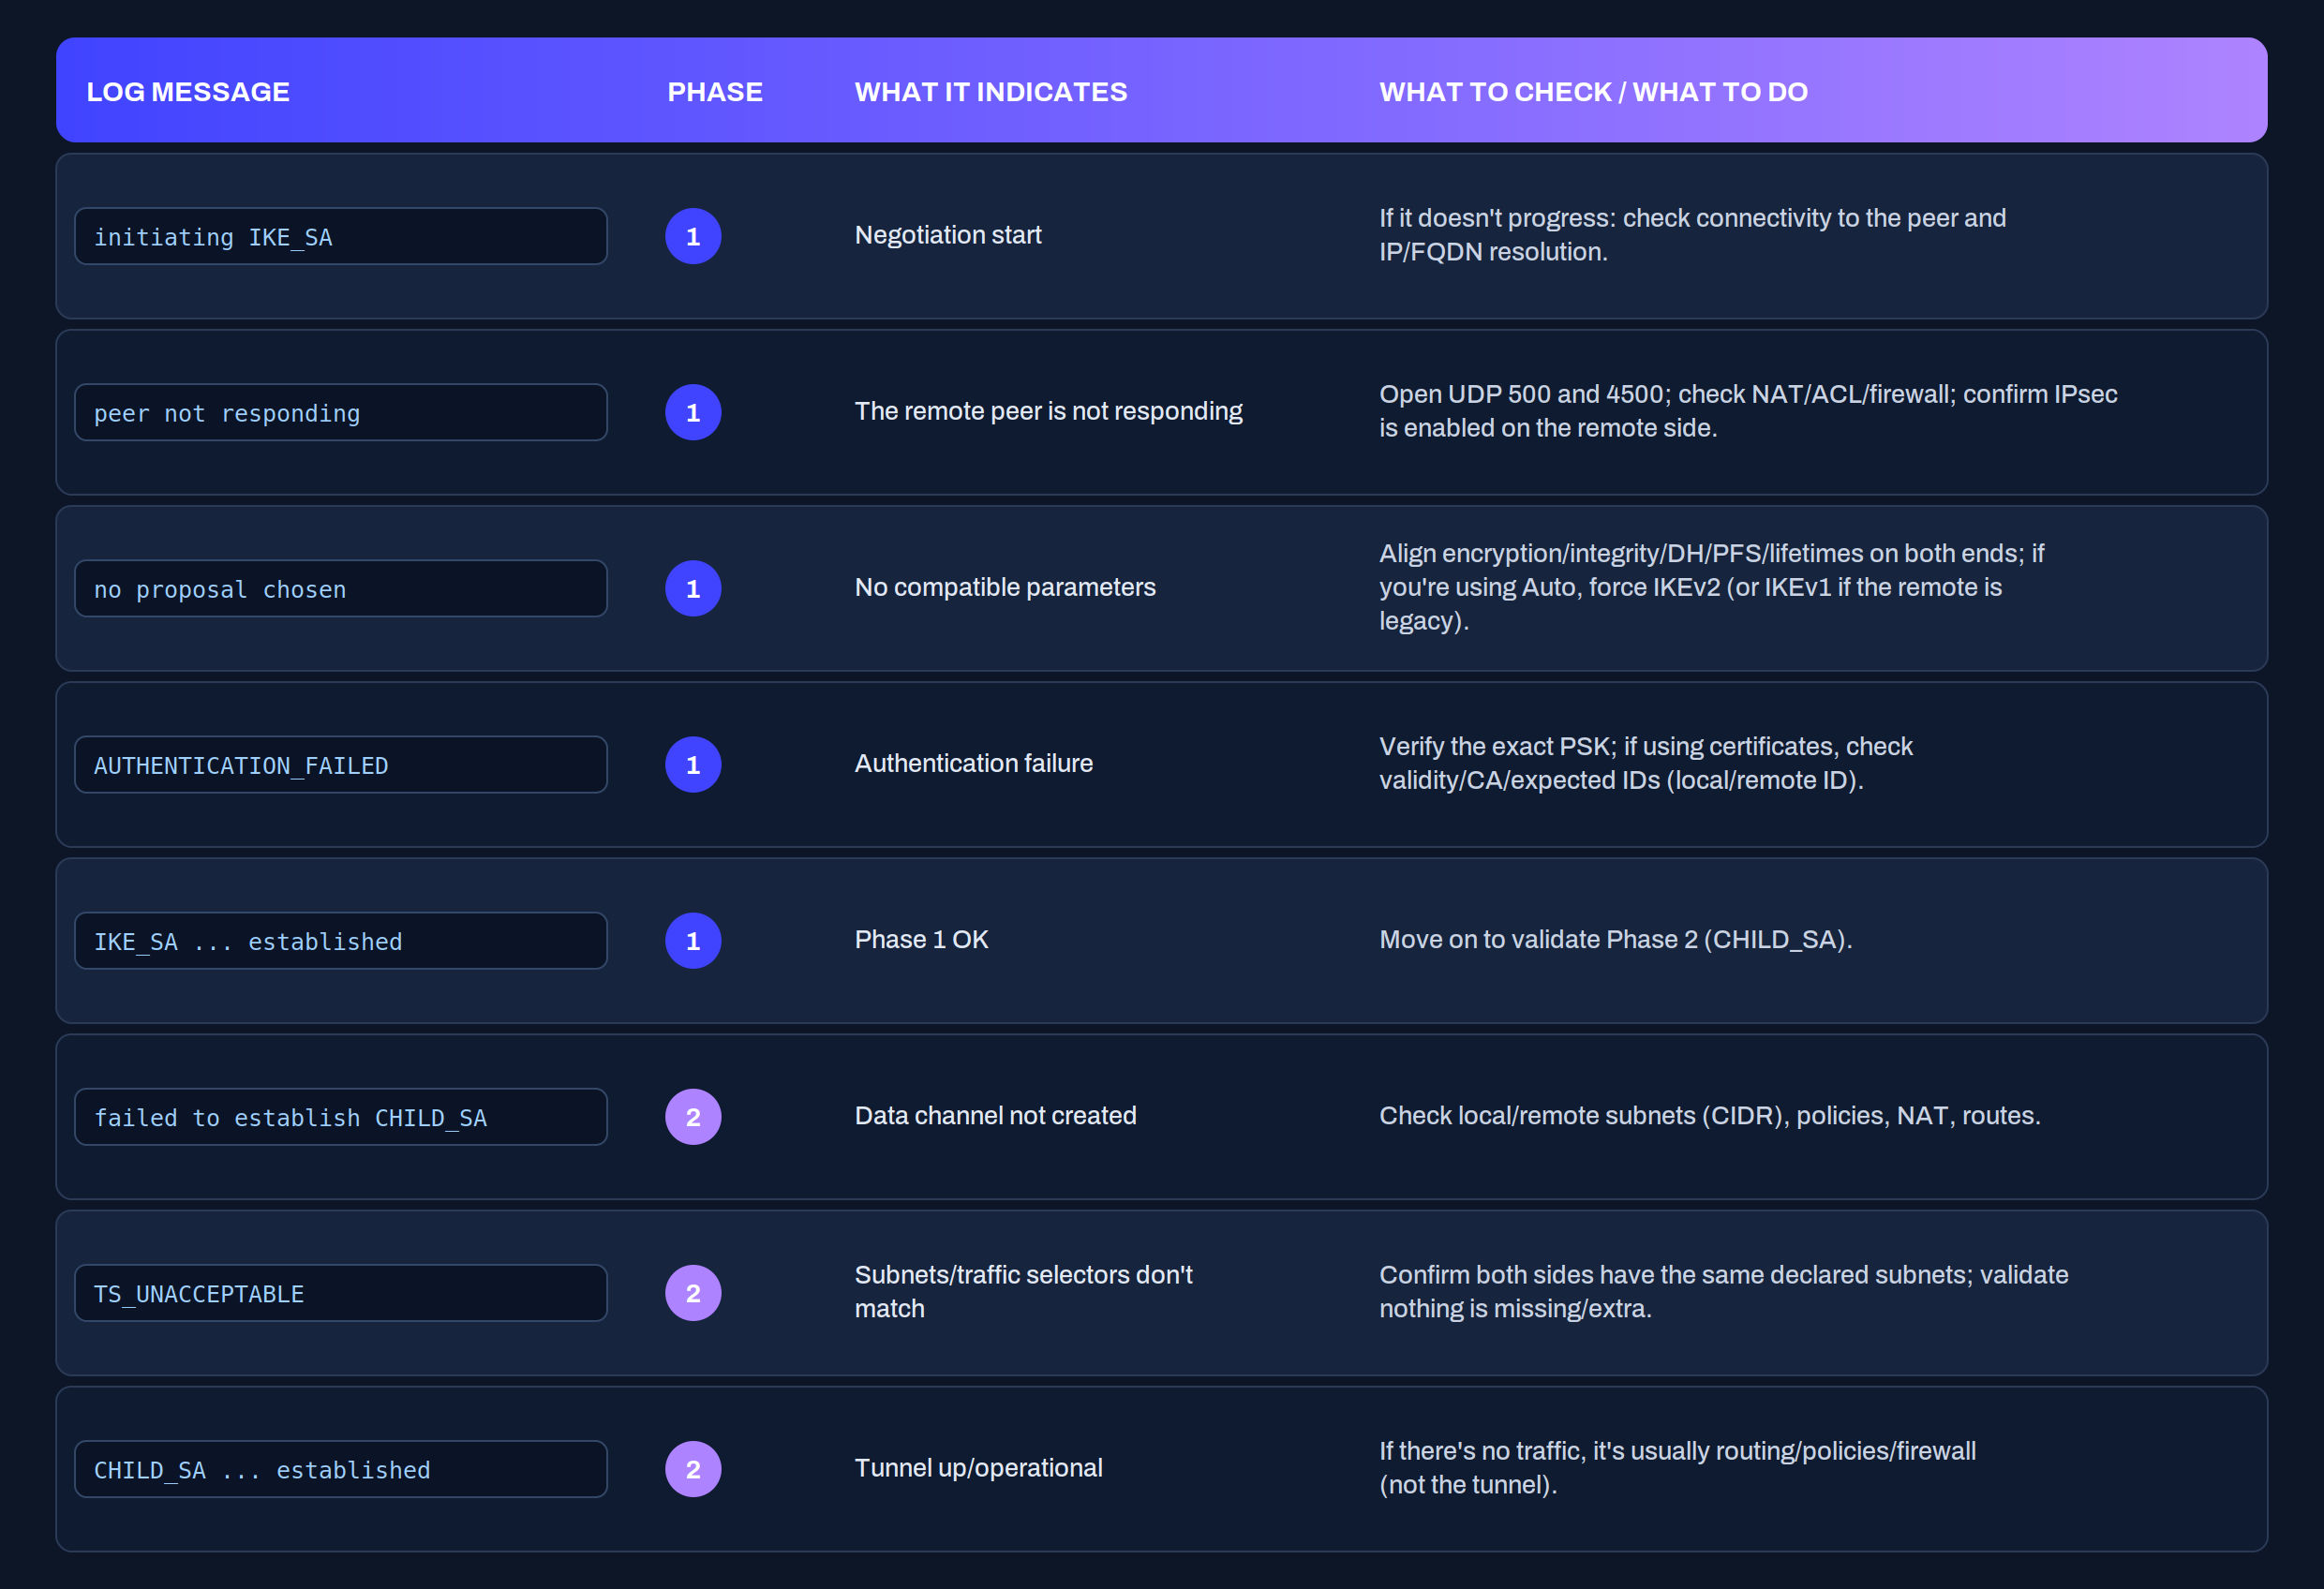
### Interpret the log messages
### Diagnosis checklist
1. Generate logs and search `error`, `failed`, `proposal`, `AUTH`, `TS_`.
2. Does `IKE_SA ... established`? If **not**, you're dealing with a Phase 1 problem (you may see `initiating IKE_SA` without getting past that). If **yes**, continue.
3. Does `CHILD_SA ... established`? If you see `failed to establish CHILD_SA`, it is usually networks, routes, or firewall (Phase 2). If **yes** appears, the tunnel is fine; if there is still no traffic, check routes and policies, not the tunnel.
4. `peer not responding` → check UDP 500/4500 and firewall/NAT.
5. `no proposal chosen` → there are settings that do not match (ciphers, groups, lifetimes).
6. `AUTHENTICATION_FAILED` → check the key (PSK) or certificates and IDs.
7. `TS_UNACCEPTABLE` → check that the subnets match exactly on both sides.
### Check from the client side
The logs tell you the phase; these commands confirm the cause from a server on your network.
For Phase 1, check connectivity with the peer and that the IPsec ports are open. On Linux:
```bash
ping
nc -vzu 500
nc -vzu 4500
```
On Windows, basic connectivity from PowerShell (UDP ports 500/4500 must be open in firewall and NAT on both sides):
```powershell
Test-NetConnection
```
For Phase 2, check that you can reach the remote subnet and that there is a route to it:
```bash
ping
ip route
```
```powershell
route print
```
### When to escalate to Partner Success
If after these steps you're still stuck, the Partner Success team will help you. To resolve it as quickly as possible, send:
* **From the log**: the first error that appears, 20-30 lines before and after to see the context, and the timestamps exactly as they appear.
* **From the tunnel**: IKE version (v1/v2/Auto), peer IP or FQDN, local and remote subnets in CIDR, whether there is NAT or firewall in between, and the exact time of the test.
Since logs rotate by size, reproduce the failure and generate the logs right after: that way the file contains exactly what needs to be looked at.
### Conclusion
With the troubleshooting console you go from "the VPN doesn't work" to "it fails in Phase 2 because of mismatched subnets" in a matter of minutes. The method is always the same: identify whether you reach `IKE_SA established` and `CHILD_SA established`, and that tells you whether to look at the initial connection or the data transfer. From there, the table and commands lead you to the cause.
---
# Agent Instructions
This documentation is published with GitBook. GitBook is the documentation platform designed so that both humans and AI agents can read, navigate, and reason over technical content effectively. Learn more at gitbook.com.
## Querying This Documentation
If you need additional information that is not directly available in this page, you can query the documentation by asking a question.
Perform an HTTP GET request on the following URL with the `ask` and `goal` query parameters:
```
GET https://docs.plenit.com/docs-en/productos/servers-1/how-to/vpn-logs-and-troubleshooting.md?ask=&goal=
```
`ask` is the immediate question: it should be specific, self-contained, and written in natural language.
`goal` is what the user is ultimately trying to achieve, the reason they need the answer. Sharing it helps GitBook give you a better, more relevant answer. A goal is most helpful when it describes the outcome the user wants rather than restating the question. For example, with `ask=how do I create an API token`, a goal like `automate deployments from our CI pipeline` lets GitBook tailor the answer to that use case.
The response will contain a direct answer to the question and relevant excerpts and sources from the documentation.
Use this mechanism when the answer is not explicitly present in the current page, you need clarification or additional context, or you want to retrieve related documentation sections.